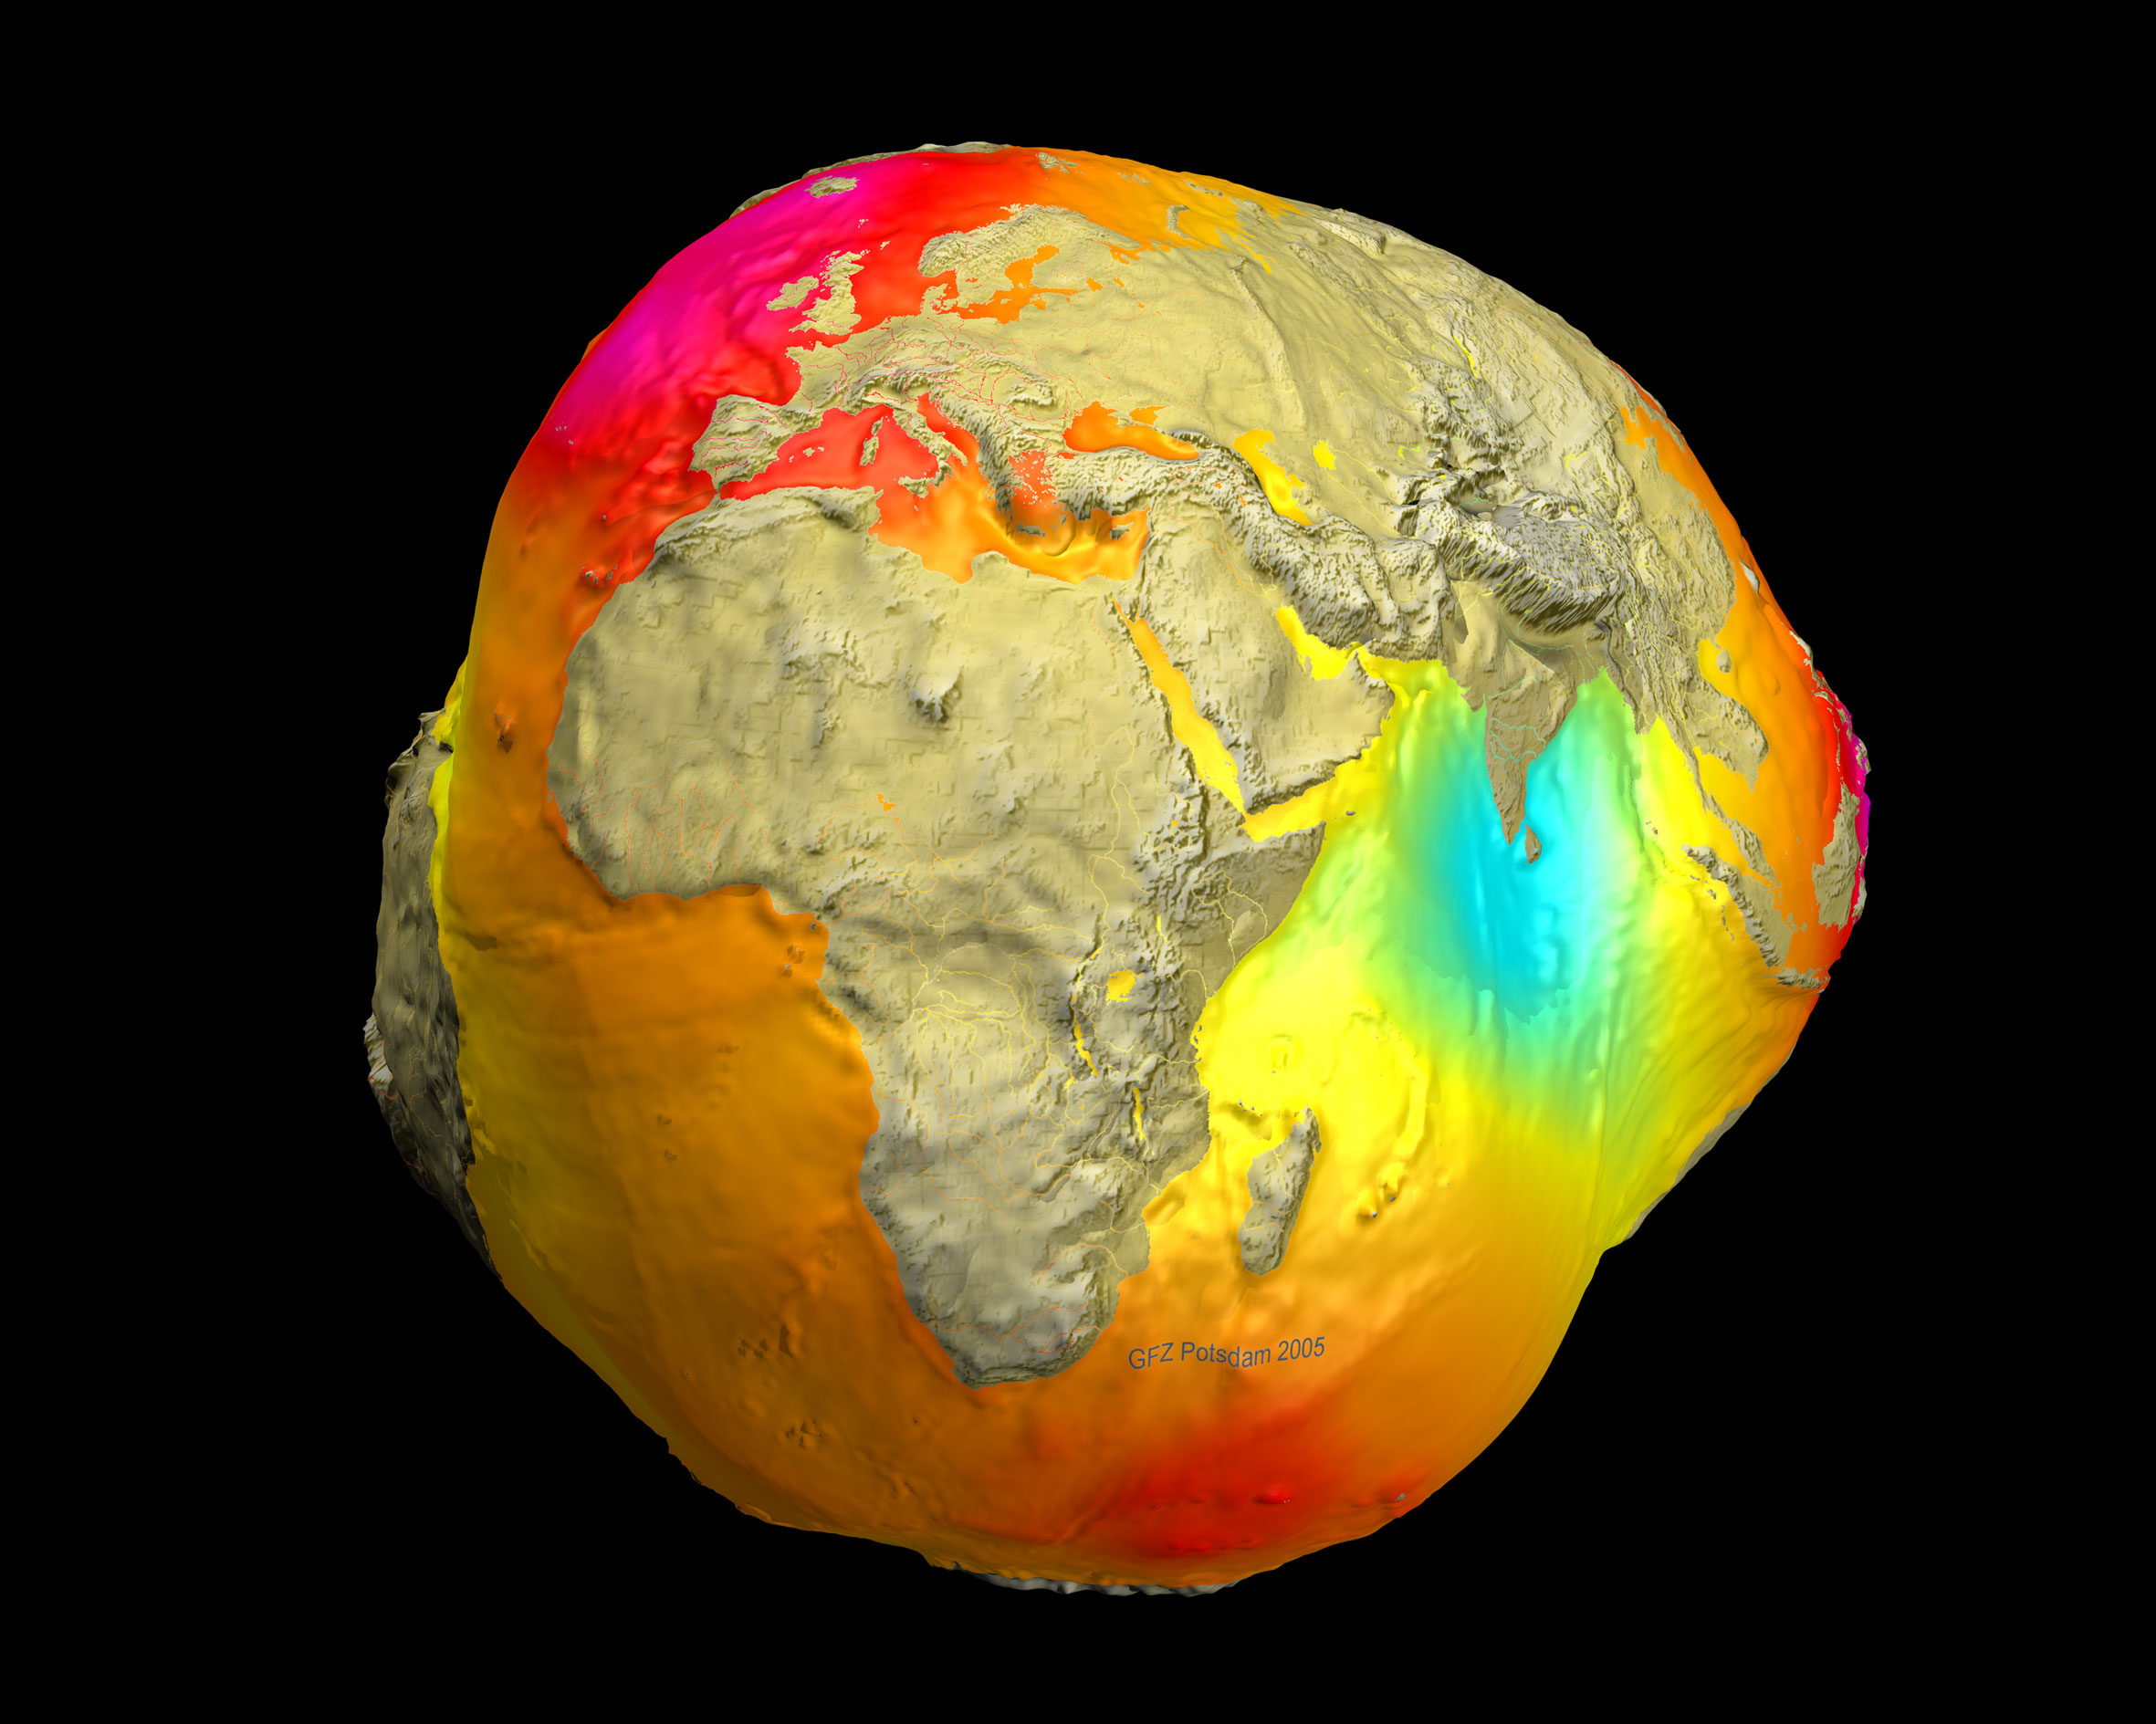
Why do some places on Earth have higher gravity than others? Sometimes the reason is unknown. To help better understand the Earth's surface, sensitive measurements by the orbiting satellites GRACE and CHAMP were used to create a map of Earth's gravitational field. Since a center for studying these data is in Potsdam, Germany, and since the result makes the Earth look somewhat like a potato, the resulting geoid has been referred to as the Potsdam Gravity Potato. High areas on this map, colored red, indicate areas where gravity is slightly stronger than usual, while in blue areas gravity is slightly weaker. Many bumps and valleys on the Potsdam Gravity Potato can be attributed to surface features, such as the North Mid-Atlantic Ridge and the Himalayan Mountains, but others cannot, and so might relate to unusually high or low sub-surface densities. Maps like this also help calibrate changes in the Earth's surface including variable ocean currents and the melting of glaciers. The above map was made in 2005, but more recent and more sensitive gravity maps of Earth were produced in 2011. Now Available: APOD 2015 Wall Calendars
¿Por qué algunas partes de la Tierra tienen una gravedad más alta que otras? A veces la razón es desconocida. Para comprender mejor la superficie terrestre, se utilizaron mediciones sensibles realizadas por los satélites en órbita GRACE y CHAMP para crear un mapa del campo gravitacional de la Tierra. Dado que un centro para estudiar estos datos se encuentra en Potsdam, Alemania, y dado que el resultado hace que la Tierra se parezca un poco a una patata, el geoida resultante se ha denominado la Patata de Gravedad de Potsdam. Las áreas altas en este mapa, coloreadas en rojo, indican zonas donde la gravedad es ligeramente más fuerte que lo normal, mientras que en las áreas azules la gravedad es ligeramente más débil. Muchas protuberancias y valles en la Patata de Gravedad de Potsdam pueden atribuirse a características superficiales, como la Dorsal Media del Atlántico Norte y las Montañas del Himalaya, pero otras no pueden explicarse así, y podrían estar relacionadas con densidades subterráneas anormalmente altas o bajas. Mapas como este también ayudan a calibrar cambios en la superficie terrestre, incluyendo corrientes oceánicas variables y el deshielo de los glaciares. El mapa anterior se realizó en 2005, pero se produjeron mapas de gravedad más recientes y más sensibles de la Tierra en 2011.