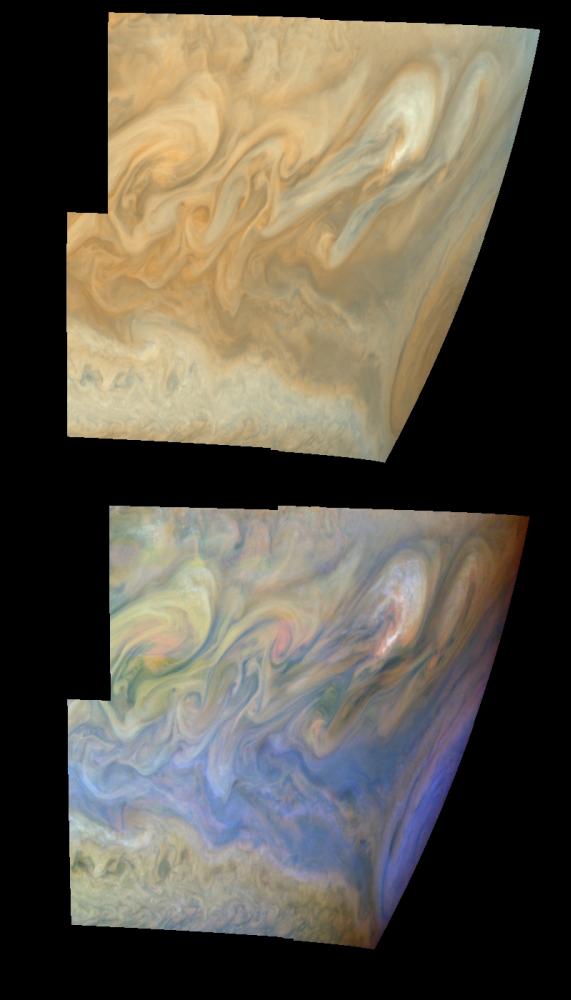
The turbulent region West of Jupiter's Great Red Spot is highlighted in this recent picture constructed from data recorded by the Galileo spacecraft. The image is color coded to show cloud height and thickness; white clouds are high and thick, light blue clouds are high and thin, and reddish clouds are low. The edge of the Red Spot itself appears blue here (lower right) and spans about 6,600 miles along the curving limb of the planet (north is up). Westward winds, deflected north by the circulation within the Great Red Spot, collide with Eastward winds at higher latitudes and generate the roiling, turbulent structures. The largest eddies near the Northwestern edge of the Red Spot are bright, suggesting upward convection and high altitude cloud formation are taking place there.
La turbulenta región al oeste de la Gran Mancha Roja de Júpiter es el tema central de esta reciente imagen construida a partir de datos registrados por la sonda espacial Galileo. La imagen está codificada en color para mostrar la altura y el espesor de las nubes: las nubes blancas son altas y densas, las nubes azul claro son altas y delgadas, y las nubes rojizas son bajas. El borde de la propia Mancha Roja aparece aquí en azul (esquina inferior derecha) y abarca aproximadamente 10.600 kilómetros a lo largo del limbo curvo del planeta (el norte está arriba). Los vientos hacia el oeste, desviados hacia el norte por la circulación dentro de la Gran Mancha Roja, colisionan con los vientos hacia el este a latitudes más altas y generan las estructuras turbulentas y agitadas que se observan. Los remolinos más grandes cerca del borde noroeste de la Mancha Roja son brillantes, lo que sugiere que en esa zona se están produciendo procesos de convección ascendente y formación de nubes a gran altitud.