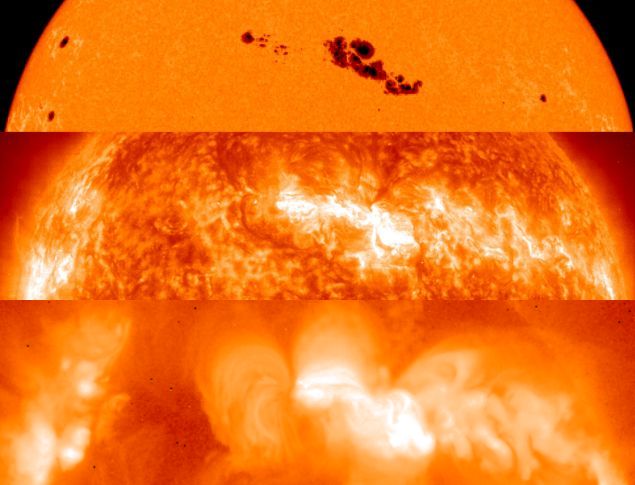
Welcome to multiwavelength astronomy! From top to bottom, these stacked panels show the largest sunspot group in a decade in visible, extreme ultraviolet, and x-ray light. All were taken on March 29, around the time the famous solar active region, cataloged as AR 9393, was at its peak size -- over 10 times the size of planet Earth. The panels illustrate how the "appearance" of the active region changes, when imaged in electromagnetic radiation (light) of progressively shorter wavelengths. In the visible light panel, dark islands of sunspots stand out against the bright solar surface, but the situation seems to be reversed in the extreme ultraviolet panel with a bright active region seen against a darker background. Finally, the x-ray panel reveals majestic loops of glowing plasma arcing far above the sunspot group. Why do pictures of the same part of the Sun look so different? Made at different wavelengths, each panel actually records a different layer in the solar atmosphere. Top to bottom, the altitude of each layer (along with temperature) increases; starting with the Sun's visible surface or photosphere (about 5 thousand kelvins), then the chromosphere / transition region (ten to a hundred thousand kelvins), and finally the solar corona (millions of kelvins).
¡Bienvenido a la astronomía de múltiples longitudes de onda! Desde arriba hacia abajo, estos paneles superpuestos muestran el grupo más grande de manchas solares en una década en luz visible, ultravioleta extremo y rayos X. Todos fueron tomados el 29 de marzo, alrededor del momento en que la famosa región activa solar, catalogada como AR 9393, alcanzó su tamaño máximo — más de 10 veces el tamaño del planeta Tierra. Los paneles ilustran cómo cambia la "apariencia" de la región activa cuando se la imagina en radiación electromagnética (luz) de longitudes de onda progresivamente más cortas. En el panel de luz visible, islas oscuras de manchas solares se destacan contra la superficie brillante del Sol, pero la situación parece invertirse en el panel de ultravioleta extremo, donde se observa una región activa brillante contra un fondo más oscuro. Finalmente, el panel de rayos X revela majestuosos bucles de plasma brillante que se arquean muy por encima del grupo de manchas solares. ¿Por qué las imágenes de la misma parte del Sol se ven tan diferentes? Tomadas en diferentes longitudes de onda, cada panel en realidad registra una capa diferente de la atmósfera solar. De arriba hacia abajo, la altura de cada capa (junto con la temperatura) aumenta; comenzando con la superficie visible del Sol o fotosfera (aproximadamente 5 mil kelvin), luego la cromosfera / región de transición (diez a cien mil kelvin), y finalmente la corona solar (millones de kelvin).