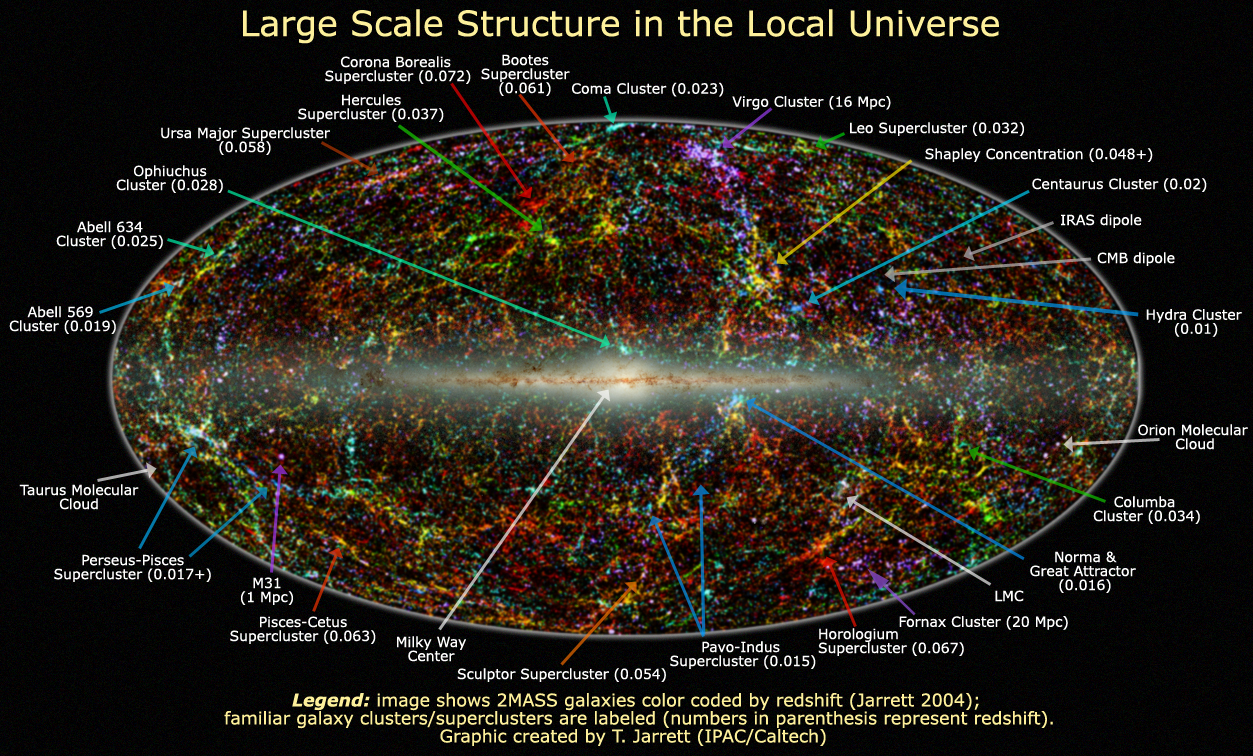
What does the universe nearby look like? This plot shows over one and a half million of the brightest stars and galaxies in the nearby universe detected by the Two Micron All Sky Survey (2MASS) in infrared light. The resulting image is an incredible tapestry of stars and galaxies that provides limits on how the universe formed and evolved. Across the center are stars that lie in the plane of our own Milky Way Galaxy. Away from the Galactic plane, vast majority of the dots are galaxies, color coded to indicate distance, with blue dots representing the nearest galaxies in the 2Mass survey, and red dots indicating the most distant survey galaxies that lie at a redshift near 0.1. Named structures are annotated. Many galaxies are gravitationally bound together to form clusters, which themselves are loosely bound into superclusters, which in turn are sometimes seen to align over even larger scale structures.
¿Cómo se ve el universo cercano? Este gráfico muestra más de un millón y medio de las estrellas y galaxias más brillantes en el universo cercano detectadas por el Catálogo de Estrellas Dobles Infrarrojas "Two Micron All Sky Survey" (2MASS) en luz infrarroja. La imagen resultante es un tapiz increíble de estrellas y galaxias que proporciona límites sobre cómo se formó y evolucionó el universo. A través del centro hay estrellas que se encuentran en el plano de nuestra propia Galaxia de la Vía Láctea. Alejándose del plano galáctico, la gran mayoría de los puntos son galaxias, codificadas por color para indicar distancia, siendo los puntos azules las galaxias más cercanas en el catálogo 2MASS, y los puntos rojos indican las galaxias más lejanas del catálogo que se encuentran a un corrimiento al rojo cercano a 0,1. Se anotan las estructuras nombradas. Muchas galaxias están gravitacionalmente unidas para formar cúmulos, que a su vez están débilmente ligados en supercúmulos, que a veces se alinean en estructuras de escala aún mayor.